Vistat
a reproducible gallery of statistical graphics
contact
- vis@supstat.com
- github.com/supstat
- twitter.com/supstat
- weibo.com/supstat
Contour Plots with D3 and R
D3 is a popular JavaScript library to draw graphics on the web. Powerful as it is, I often feel it is limited to me as a statistician, especially a statistician spoiled by R – in which I can draw plots without thinking of primitives such as points, lines, segments and so on, and all kinds of statistical functions are there for me to call. In this article I explain how to combine R and D3 to draw a contour plot.
Computing in R

The computation of contour lines can be challenging to JavaScript but is extremely easy with R
using the contourLines() function, so we pre-process the data and make it ready to JavaScript. We
make use of the good old volcano dataset here and draw a contour plot to visualize the altitude
corresponding to a grid of latitudes and longitudes (the picture above of the volcano is from
Wikipedia).
res = contourLines(volcano)
str(res[1:2])  # first two elements of the list
## List of 2
## $ :List of 3
## ..$ level: num 100
## ..$ x : num [1:47] 1 0.988 0.978 0.977 0.965 ...
## ..$ y : num [1:47] 0.552 0.552 0.567 0.568 0.568 ...
## $ :List of 3
## ..$ level: num 100
## ..$ x : num [1:16] 0.908 0.919 0.93 0.942 0.943 ...
## ..$ y : num [1:16] 0 0.0151 0.0151 0.0151 0.0167 ...We can see the results returned by contourLines() is a list of sub-lists: each sub-list contains
the x-y coordinates of polylines. Now we convert this list to a JSON array of the form:
[
{
  "x": [0, 0, 0, ...],
  "y": [0, 0, 0, ...]
},
{
  "x": [0, 0, 0, ...],
  "y": [0, 0, 0, ...]
},
...
]
And write the data to a script tag:
xy = paste(unlist(lapply(res, function(z) {
  xs = paste(round(z$x, 3), collapse = ",")
  ys = paste(round(z$y, 3), collapse = ",")
  sprintf("{\n  \"x\": [%s],\n  \"y\": [%s]\n}", xs, ys)
})), collapse = ", \n")
cat("<script>", sprintf("var data = [%s]", xy), "</script>", sep = "\n")
Draw lines in D3
Now we are ready to call D3 to draw all the lines (see the HTML source code of this page):
This is indeed a plot drawn by D3; if you do not believe it, mouse over the lines and you will see them highlighted in yellow, or refresh this page to see line width transition from 0 to 2.
With R, it is just one line of code but it is a static plot (not interactive):
contour(volcano, col = "darkgreen", lwd = 2)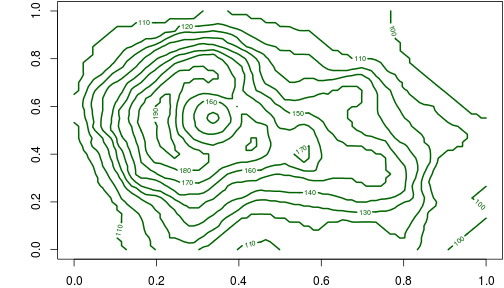
Conclusion
It is rare that we solve a problem with a single tool. Take the advantages of all tools instead of
blindly believing that one ring will rule them all. R is good for statistical computing and
graphics, and D3 is awesome for the web. Both are good in one way but weak in another, so let’s
make 1 + 1 > 2.
