Vistat
a reproducible gallery of statistical graphics
contact
- vis@supstat.com
- github.com/supstat
- twitter.com/supstat
- weibo.com/supstat
Make XKCD Style Graphs in R
Fonts play an important role in graphics. This article was motivated from a StackOverflow post, and shows how to draw xkcd style graphs in R using the Cairo package. Before get started, you need to install the Humor Sans font (please Google it yourself).
Set up fonts for R
After the font has been installed, we can tell Cairo to use it:
library(Cairo)
CairoFonts(
  regular = "Humor Sans:style=Regular",
  bold = "Humor Sans:style=Bold",
  italic = "Humor Sans:style=Italic",
  bolditalic = "Humor Sans:style=Bold Italic,BoldItalic"
)
Draw it
Now we use the CairoPNG() device to save a plot. Because I’m using knitr, I only need to
specify the chunk option dev='CairoPNG' instead of really opening the device in the code below.
# you may need CairoPNG() and dev.off() around this chunk
set.seed(20121108)
x = seq(1, 10, 0.1)
r = function() runif(length(x), -0.05, 0.05)
y1 = sin(x) + r()
y2 = cos(x) + r()
# draw the lines and texts
par(mar = c(2, 0.1, 0.1, 0.1))
plot.new()
plot.window(range(x), c(-1.5, 1))
grid()
matplot(x, cbind(y1, y2, y2), type = "l", lty = 1, col = c("black",
  "white", "red"), lwd = c(3, 15, 3), add = TRUE)
axis(1, c(2, 5, 6, 9), c("YARD", "STEPS", "DOOR", "INSIDE"), lwd = 0,
  line = -1)
text(7, -1.25, "A SIN AND COS CURVE", cex = 1.5)
lines(x, -1.5 + runif(length(x), -0.005, 0.005), xpd = NA, lwd = 2)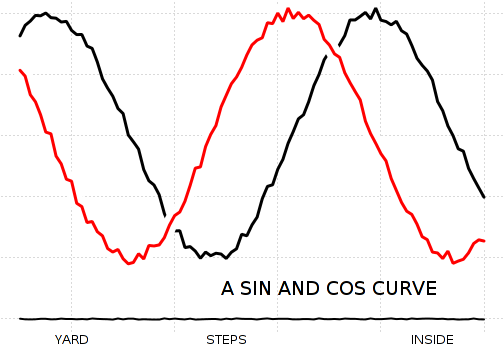
There are other ways to use additional fonts in R graphics, such as the tikzDevice and extrafonts package; the former requires knowledge of LaTeX, and the latter is easier to use.
Acknowledgments
I thank Mark Bulling for the answer under the SO post. I used base R graphics instead of ggplot2 as Mark did because I think the pen-and-paper model of base R is more natural for drawing such a plot (the grammar of graphics seems to be overkill).
Session info
Since I’m not entirely sure about how Cairo performs under Windows; here is my R session info:
print(sessionInfo(), locale = FALSE)## R version 3.0.1 (2013-05-16)
## Platform: x86_64-pc-linux-gnu (64-bit)
##
## attached base packages:
## [1] stats graphics grDevices utils datasets base
##
## other attached packages:
## [1] Cairo_1.5-2 knitr_1.4.9
##
## loaded via a namespace (and not attached):
## [1] codetools_0.2-8 digest_0.6.3 evaluate_0.4.9
## [4] formatR_0.9 stringr_0.6.2 tools_3.0.1