Vistat
a reproducible gallery of statistical graphics
contact
- vis@supstat.com
- github.com/supstat
- twitter.com/supstat
- weibo.com/supstat
Draw Easter Eggs
This article shows you how to draw an egg with R. I wrote this article after I learned to use the
animation package for one week. So I will show you the simplest
way to create an animated figure. The only function used in this package is ani.pause().
Let’s get started!
A simple egg
The equations that define an egg are:
In the figure below, let’s swap the x axis and y axis for an egg in the vertical direction.
t = seq(-pi, pi, by = 0.01)
H = 1
x = H * 0.78 * cos(t/4) * sin(t)
y = -H * cos(t)
par(mar = rep(0, 4))
plot(x, y, type = "l", xlim = c(-1, 1), ylim = c(-1, 1), asp = 1,
  col = "orange1", lwd = 5, axes = FALSE)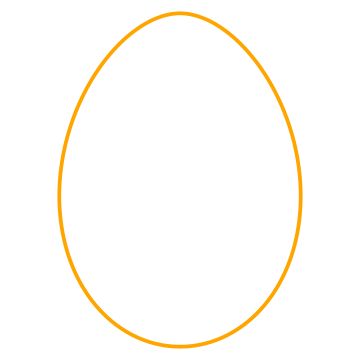
We need a Rotation matrix to draw the rotating egg:
The ani.pause() function is called to pause for a time interval (by default specified in
ani.options('interval')) and flush the current device. We draw a egg with with different angles
in 30 images, and you will see the egg rotating below:
library(animation)
egg_rotation = function(H = 1, angle = seq(0, pi * 2, length = 30),
  pos = c(0, 0)) {
  t = seq(-pi, pi, by = 0.01)
  for (i in 1:length(angle)) {
    x = H * 0.78 * cos(t/4) * sin(t)
    y = -H * cos(t)
    # Rotation matrix
    x1 = cos(angle[i]) * x - sin(angle[i]) * y + pos[1]
    y1 = sin(angle[i]) * x + cos(angle[i]) * y + pos[2]
    cols = colors()
    flag = sample(1:length(cols), 1)
    plot(x1, y1, type = "l", xlim = c(-1, 1), ylim = c(-1, 1),
      asp = 1, col = cols[flag], lwd = 8, axes = FALSE)
    ani.pause(0.1)
  }
}
par(mar = rep(0, 4))
egg_rotation()
Another example:
library(animation)
egg = function(h = rnorm(1), angle = rnorm(1), pos = rnorm(2)) {
  t = seq(-pi, pi, by = 0.01)
  for (i in 1:10) {
    H = h - h/10 * i
    x = H * 0.78 * cos(t/4) * sin(t)
    y = -H * cos(t)
    # Rotation matrix
    x1 = cos(angle) * x - sin(angle) * y + pos[1]
    y1 = sin(angle) * x + cos(angle) * y + pos[2]
    cols = colors()
    flag = sample(1:length(cols), 1)
    plot(x1, y1, type = "l", xlim = c(-1, 1), ylim = c(-1, 1),
      asp = 1, col = cols[flag], lwd = 8, axes = FALSE)
    ani.pause(0.1)
  }
}
par(mar = rep(0, 4))
set.seed(123)
for (j in 1:10) {
  egg()
  ani.pause(1)
}
3D eggs
If you want to draw a 3D egg. The rgl package can help you do it. The 3D egg is just a perturbation of a sphere. The function is:
Here we set $c=0.2, b=0.3$.
meshgrid <- function(a, b) {
  list(x = outer(b * 0, a, FUN = "+"), y = outer(b, a * 0, FUN = "+"))
}
library(rgl)
c = 0.2
b = 1.7
theta = seq(0, 2 * pi, length = 40 * 4)
phi = seq(0, pi, length = 40 * 4)
theta1 = meshgrid(theta, phi)$x
phi2 = meshgrid(theta, phi)$y
x = (1 + c * phi2) * sin(phi2) * cos(theta1)
y = (1 + c * phi2) * sin(phi2) * sin(theta1)
z <- b * cos(phi2)
surface3d(x, y, z, color = rainbow(10))
par3d(zoom = 0.7)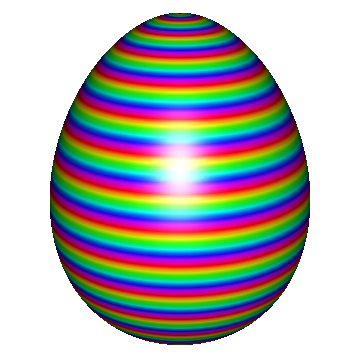
References
