Vistat
a reproducible gallery of statistical graphics
contact
- vis@supstat.com
- github.com/supstat
- twitter.com/supstat
- weibo.com/supstat
Making Visual Illusions in R
This article demonstrates how to make visual
illusions with R. A visual illusion is a distortion
of form, size or color in the visual field. In the animation
package, functions vi.grid.illusion() and vi.lilac.chaser() can
be used to produce visual illusions.
Scintillating grid illusion
vi.grid.illusion() function provides illustrations for the Scintillating grid illusion and
Hermann grid illusion. They are two most common types of grid
illusions.
You can see dark dots appear and disappear rapidly at random intersections.
library(animation)
vi.grid.illusion()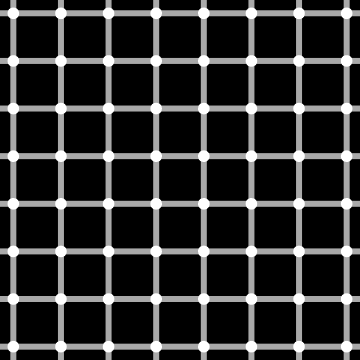
Hermann grid illusion
From Hermann grid illusion picture, you can see grey blobs disappear when looking directly at an intersection.
vi.grid.illusion(type = "h", lwd = 22, nrow = 5, ncol = 5, col = "white")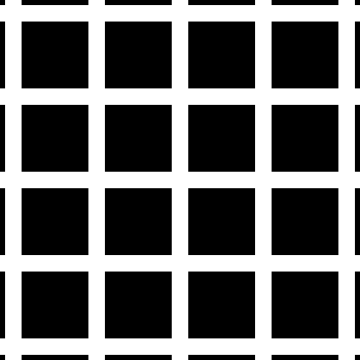
Lilac Chaser
We can draw a Lilac chaser with the function
vi.lilac.chaser().
Stare at the center cross for a few (say 30) seconds to experience the illusion.
- A gap running around the circle of lilac discs;
- A green disc running around the circle of lilac discs in place of the gap;
- The green disc running around on the grey background, with the lilac discs having disappeared in sequence.
ani.options(nmax = 20)
par(mar = c(1, 1, 1, 1))
vi.lilac.chaser()
Note
Don’t worry if you can’t see all the phenomena described. For many illusions, there is a percentage of people with perfectly normal vision who just don’t see it, often for reasons currently unknown.
Further reading
You can see more illusions created by Kohske in R, which also illustrated the power of the grid package.
