Vistat
a reproducible gallery of statistical graphics
contact
- vis@supstat.com
- github.com/supstat
- twitter.com/supstat
- weibo.com/supstat
Cheat Sheets for Plotting Symbols and Color Palettes
This cheat sheet shows a few commonly used plotting symbols and color palettes in R. Now you do not need to memorize the facts like “19 is the big solid dot and 21 is an open circle that can have a different background color” – just bookmark this cheat sheet. In fact it was motivated by Dr Rafael Irizarry, who printed the color palettes on a piece of paper and pinned that to the wall in his office.
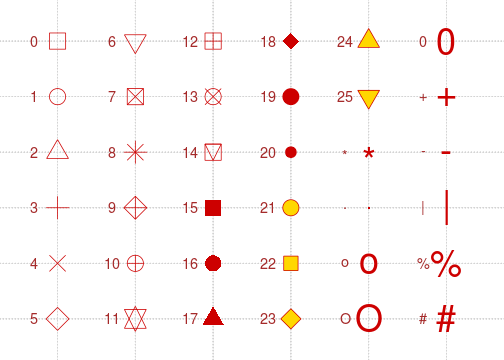
Plotting symbols (pch)
There are many plotting symbols in the graphics package. We can set the pch parameter to set
the symbols. See ?points for more information.
Below is a figure containing the plot symbols from pch = 0 to 25 along with some
character-based plot symbols. We can use, for example, plot(x, y, pch = 3) for plus signs (+)
in a scatterplot.
Color palettes
The default color palette in R:
(pal = palette())## [1] "black" "red" "green3" "blue" "cyan" "magenta"
## [7] "yellow" "gray"par(mar = rep(0, 4))
pie(rep(1, length(pal)), labels = sprintf("%d (%s)", seq_along(pal),
pal), col = pal)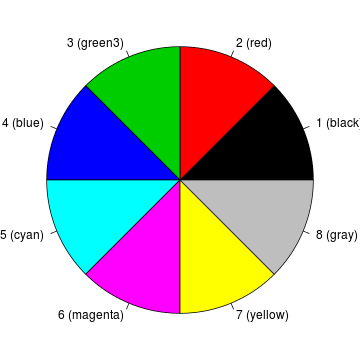
Below are the color palettes in RColorBrewer (if you do not want to use ggplot2, you should
consider using this package to generate colors for your plots; just do not use the meaningless
rainbow() palette):
library(RColorBrewer)
par(mar = c(0, 4, 0, 0))
display.brewer.all()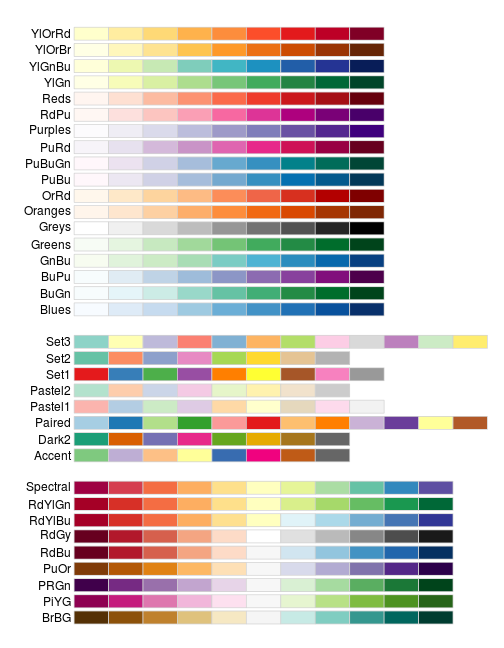
# generate 8 colors from the Set2 palette
brewer.pal(8, "Set2")
## [1] "#66C2A5" "#FC8D62" "#8DA0CB" "#E78AC3" "#A6D854" "#FFD92F"
## [7] "#E5C494" "#B3B3B3"In R, the function colors() returns a vector of 657 color names. When you really
need to specify the color by its name, you are recommended to check out this nice color
chart created by Earl F.
Glynn.
